Dashboards/Visualizations
- - -
- - -

- - -
- - -
R Graphs
A small collection of visualizations created in R with ggplot2 and various other packages. In respective order of:
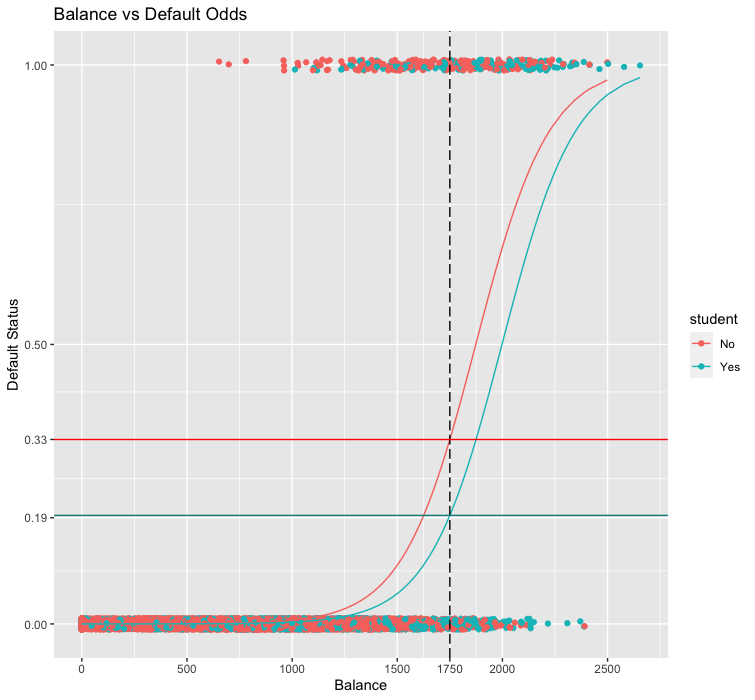
- Logistic regression plot of the probability of an account defaulting.
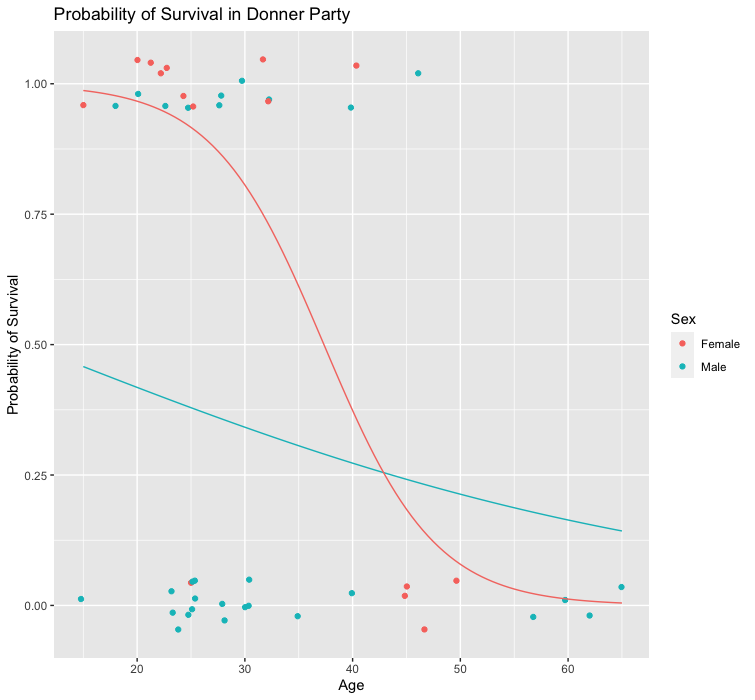
- A graph predicting Donner Party survivors.
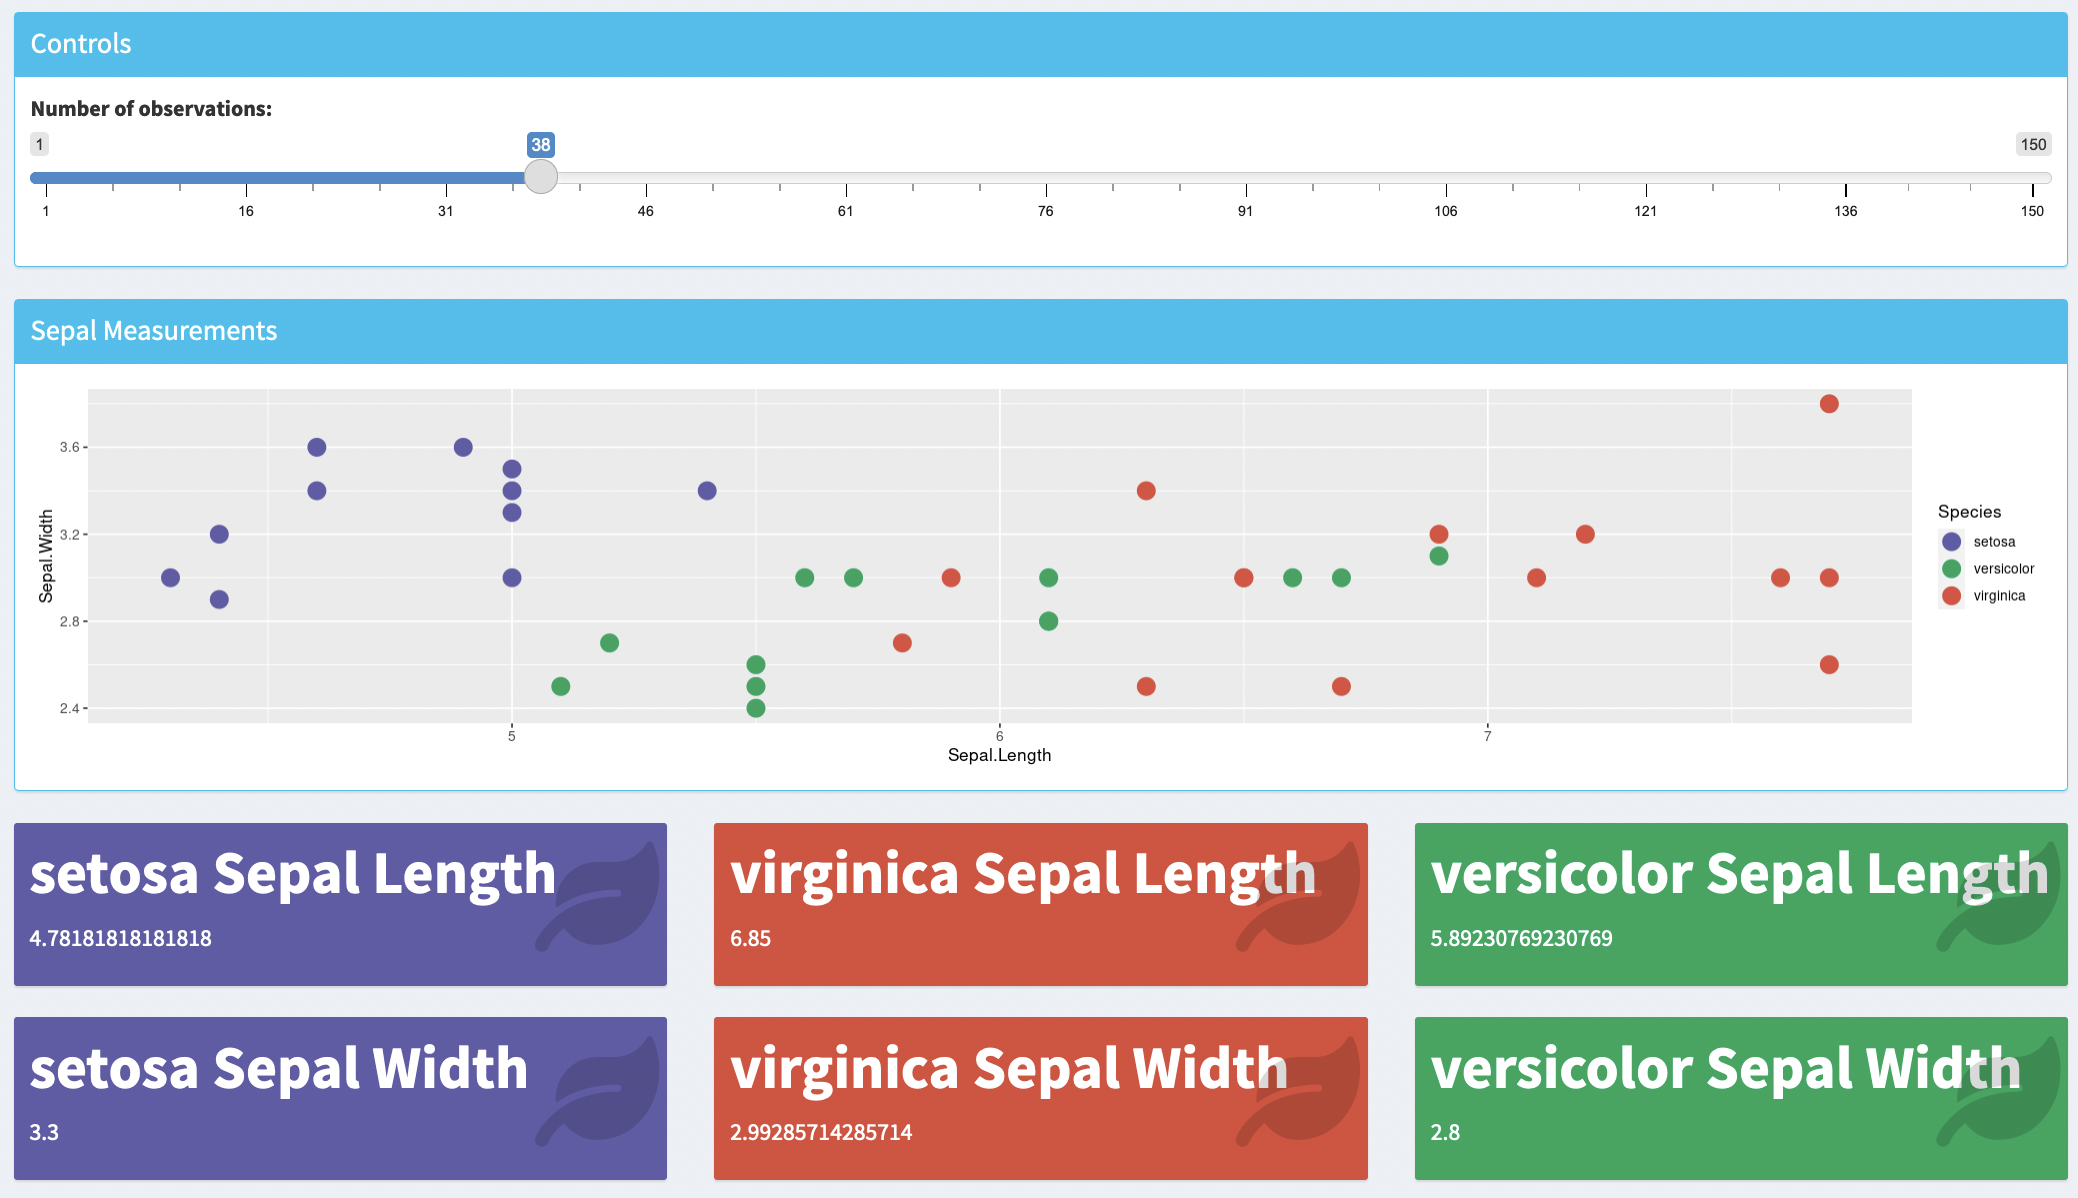
- Generalized pairs plot of Iris data.
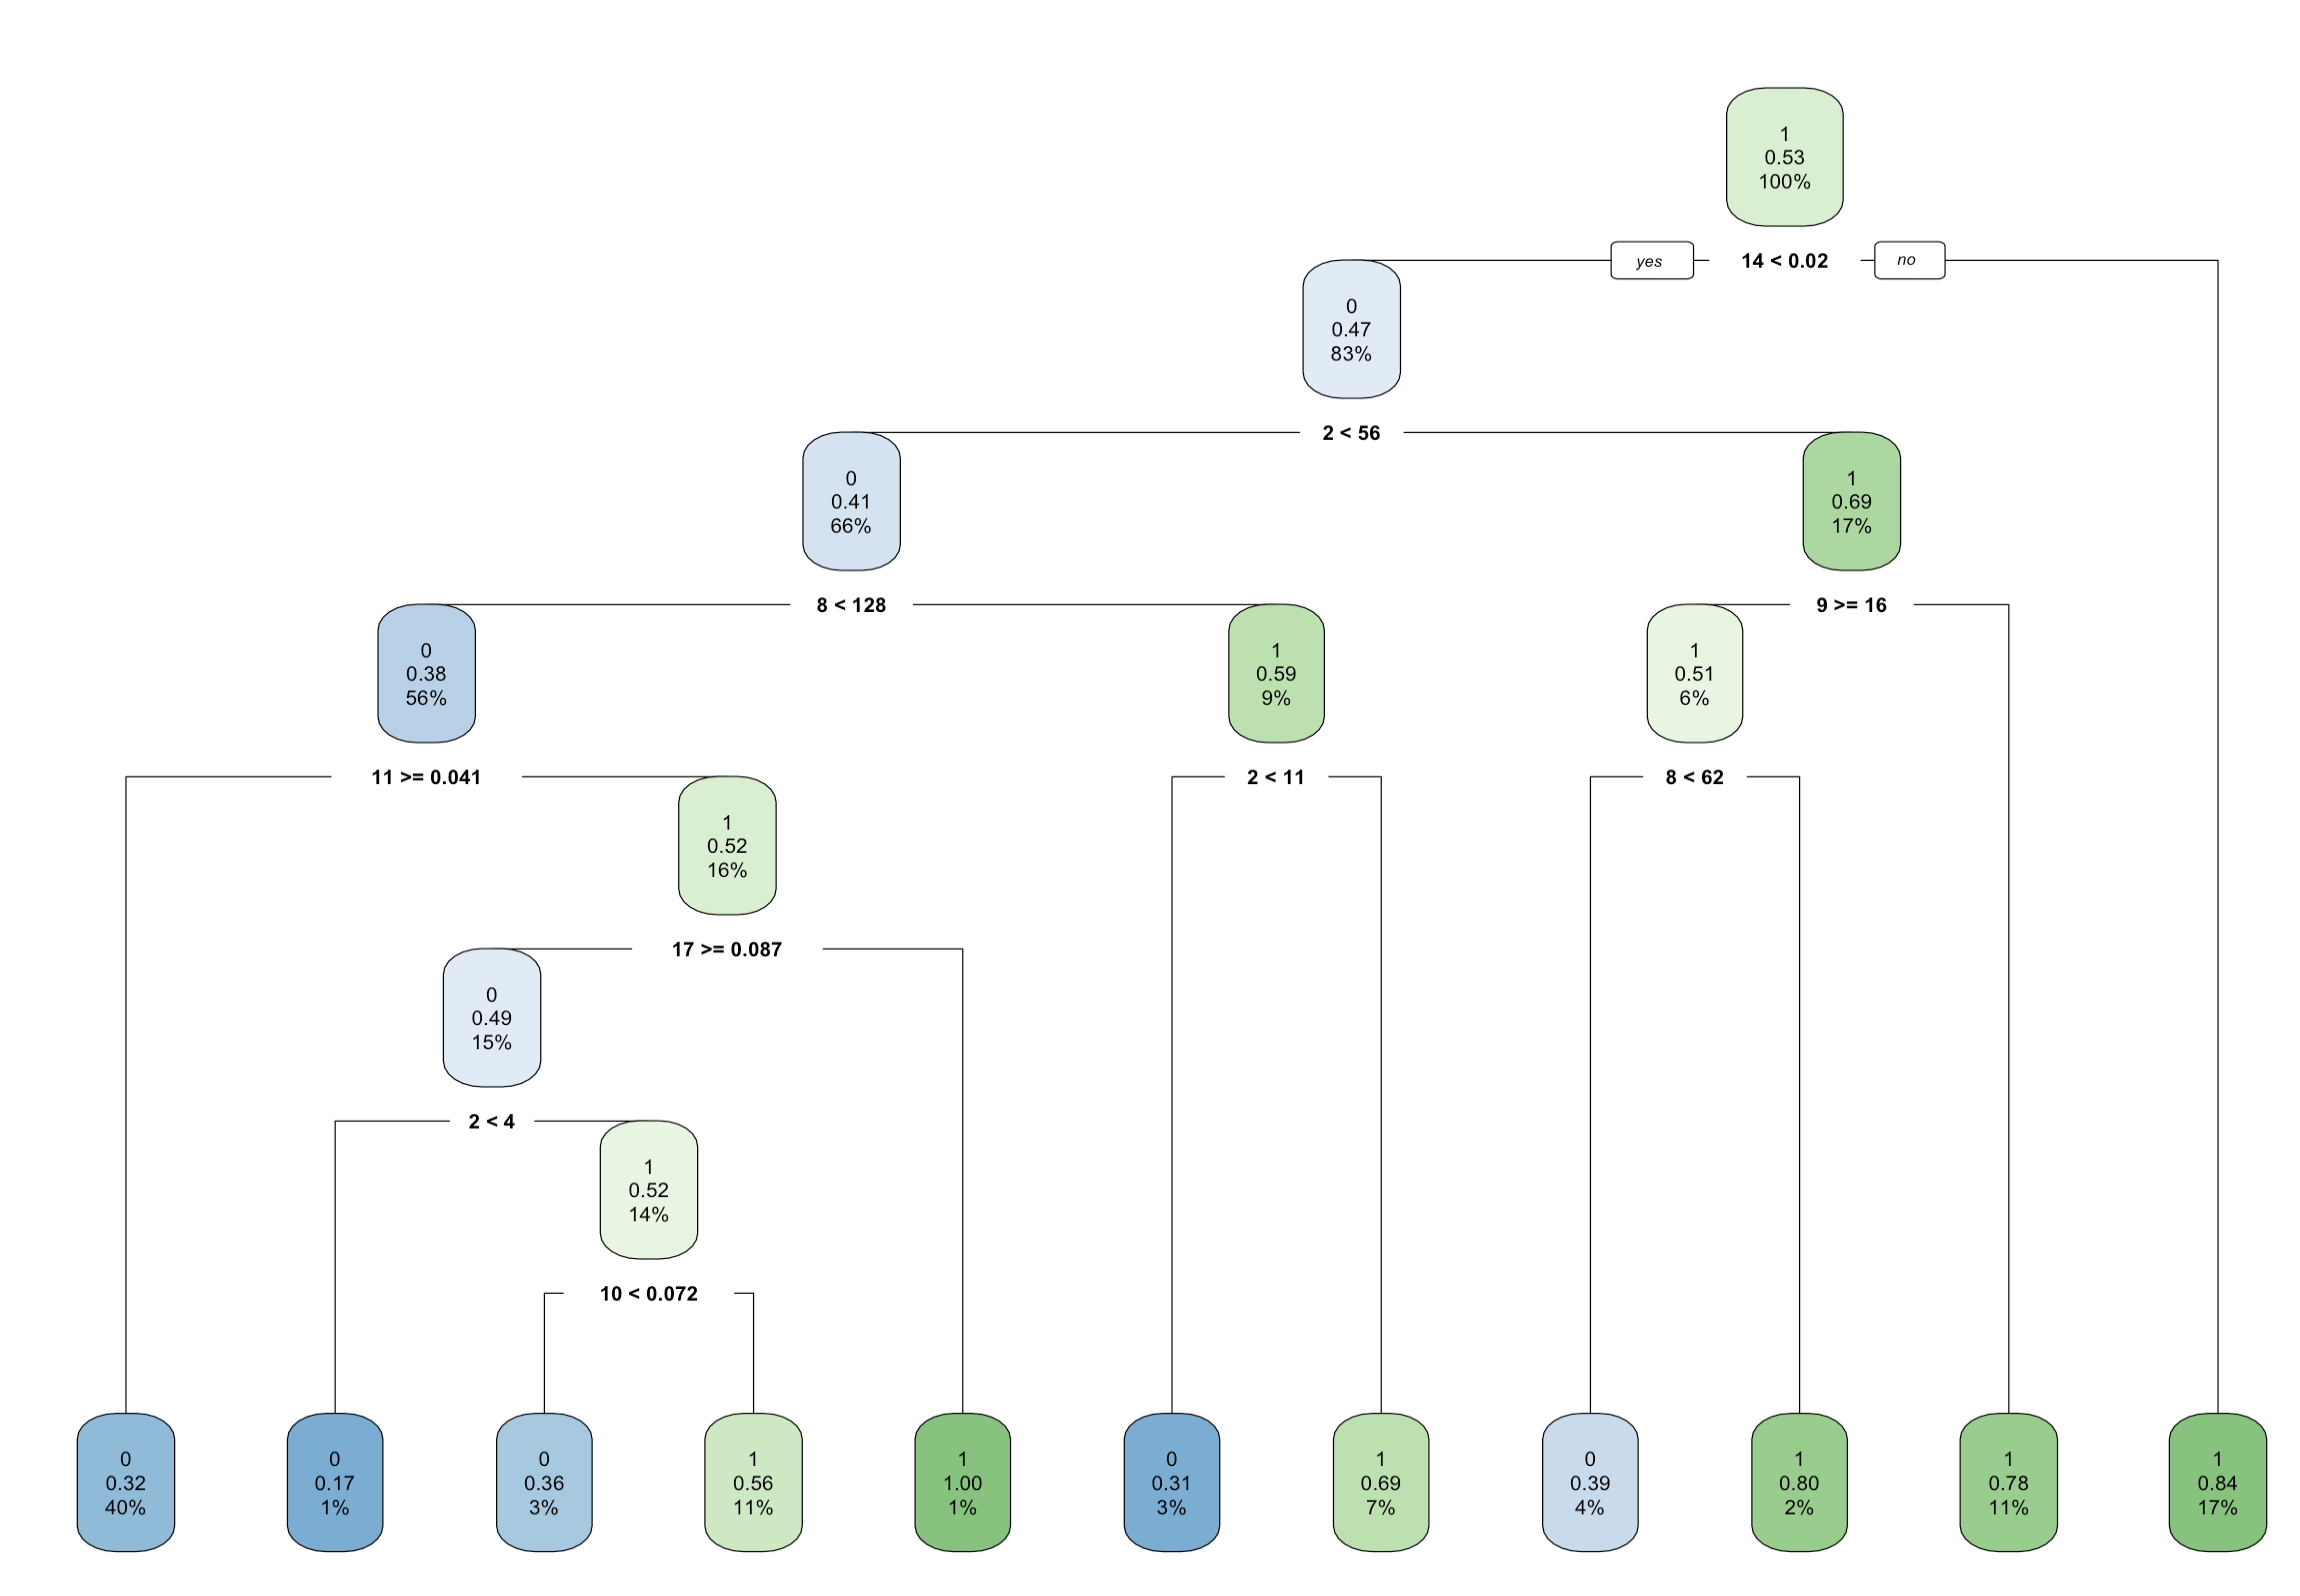
- Decision tree to predict the prescence of diabetic retinopathy signs or not (refer to source for meaning behind variable numbers).
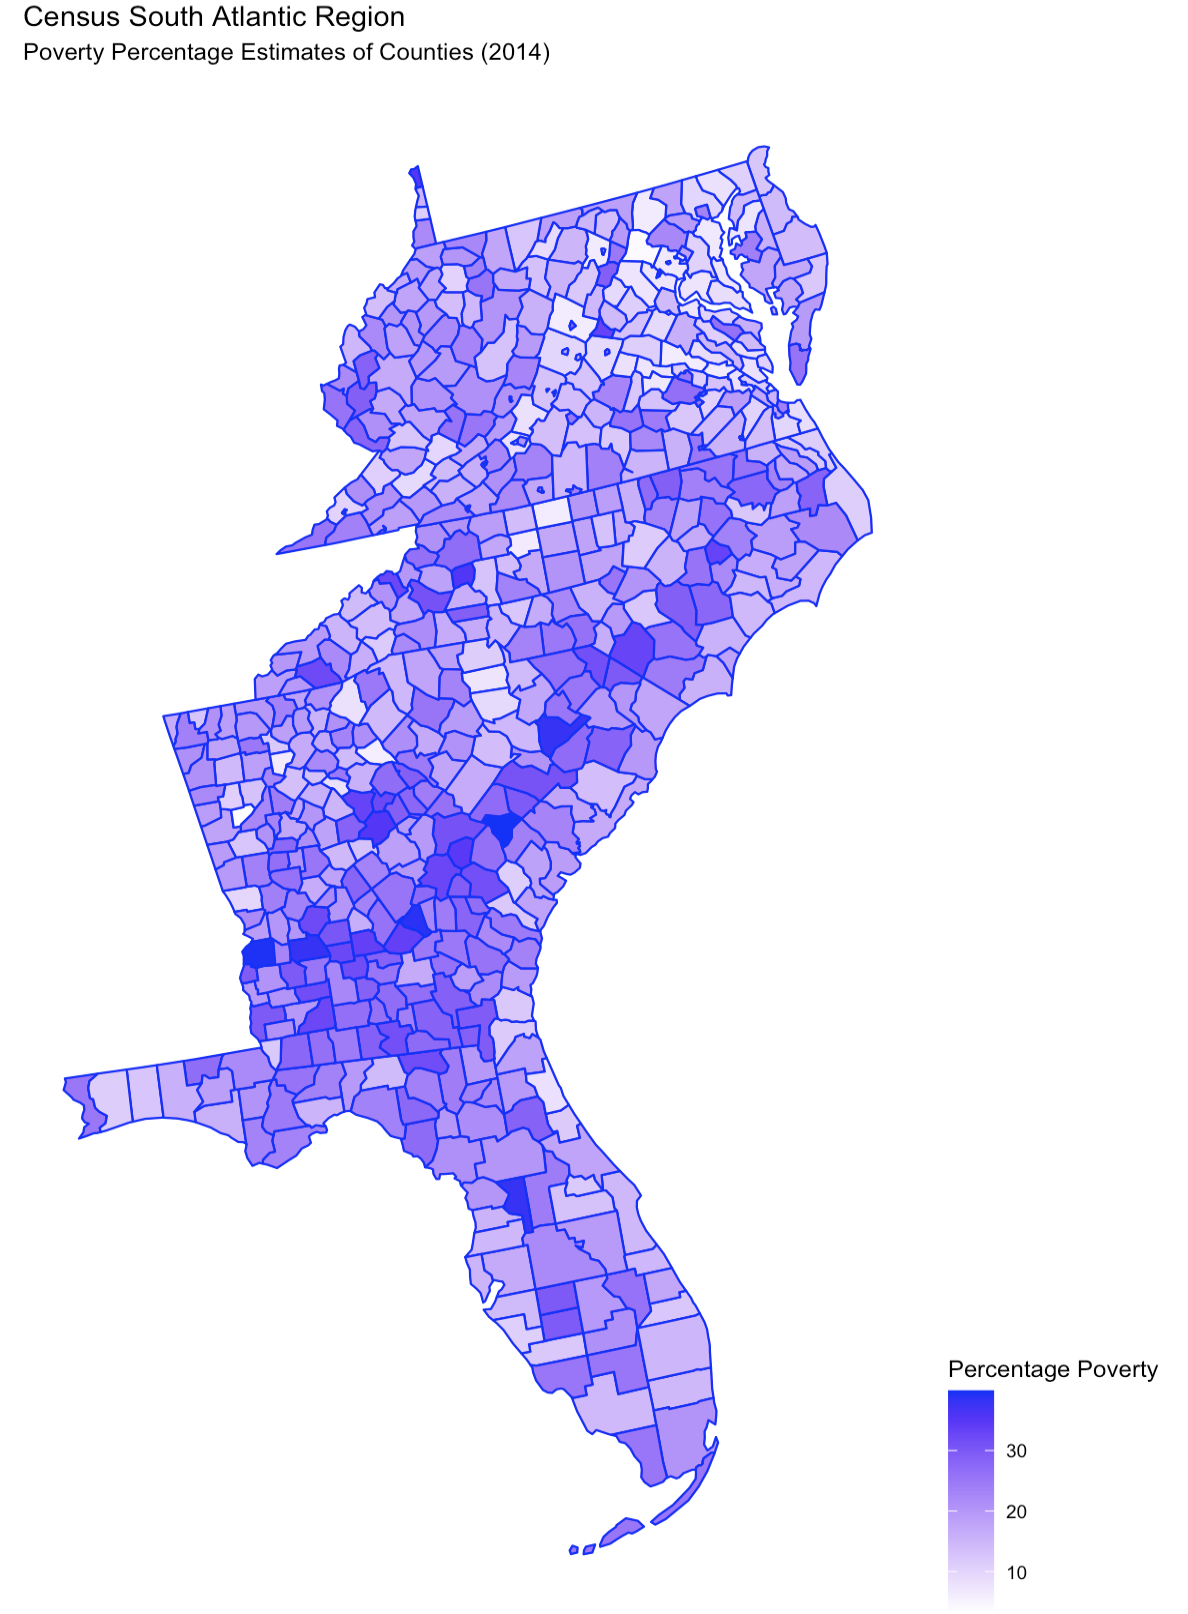
- US census poverty percentage estimates by county for 2014 for the South Atlantic Region. (usmaps package)